


UX research has a presentation problem that is easy to mistake for a slide-design problem.
The study is finished. The interviews have been coded, usability sessions reviewed, patterns clustered, edge cases argued over and recommendations negotiated. Then the researcher opens a presentation tool and begins constructing the artifact that is supposed to carry all of that work into a room where someone can actually make a decision.
That is usually where two incompatible ambitions collide. The deck is expected to preserve the research and persuade the audience. It becomes a report, a methodology record, an evidence archive, a stakeholder update and a call to action at the same time. Thirty slides later, the research may be complete on paper and strangely absent from the room.
EPIC2026, the Ethnographic Praxis in Industry Conference held in Chicago this October, offers a useful provocation. Alongside papers, case studies and prototypes, the conference treated PechaKucha as a formal, competitively reviewed presentation track for ethnographic work. Its guidance is unusually explicit: these talks are not mini case-study debriefs stuffed with findings. They are visually driven provocations that use narration and still images to surface perspective, tension and context.
That distinction may be more useful to UX researchers than another template for a “better research deck.” The best UX research presentation may not be the one that contains the most research. It may be the one that knows what the presentation itself is for.
The Research Readout Has a Format Problem
Most UX research presentations inherit the logic of the report. Start with goals. Explain methodology. Introduce the participants. Walk through findings. Add quotes. Add recommendations. Put the detailed evidence in the appendix if there is still room.
The structure is defensible because research needs traceability. It is also often poor communication because the meeting has a different job from the archive.
That distinction has been hiding in plain sight for years. In UX Research, Brad Nunnally and David Farkas recommend separating a short executive presentation from the fuller research record rather than making one master deck serve every audience. The UK Government Service Manual similarly recommends a compact findings deck, with only a small amount of method, a limited number of findings and clear next steps.
More recent guidance is even more decision-oriented. Baymard’s 2026 work on presenting UX research findings to stakeholders argues that the readout should be structured around business decisions rather than discoveries. The evidence still matters, but evidence is there to move the decision, not to prove how much work the research team completed.
The research deck is not the research.
This is the conceptual opening for PechaKucha. The format does not solve weak synthesis, poor recruiting or thin evidence. It solves a different problem: the temptation to confuse completeness with communication.
What EPIC Gets Right
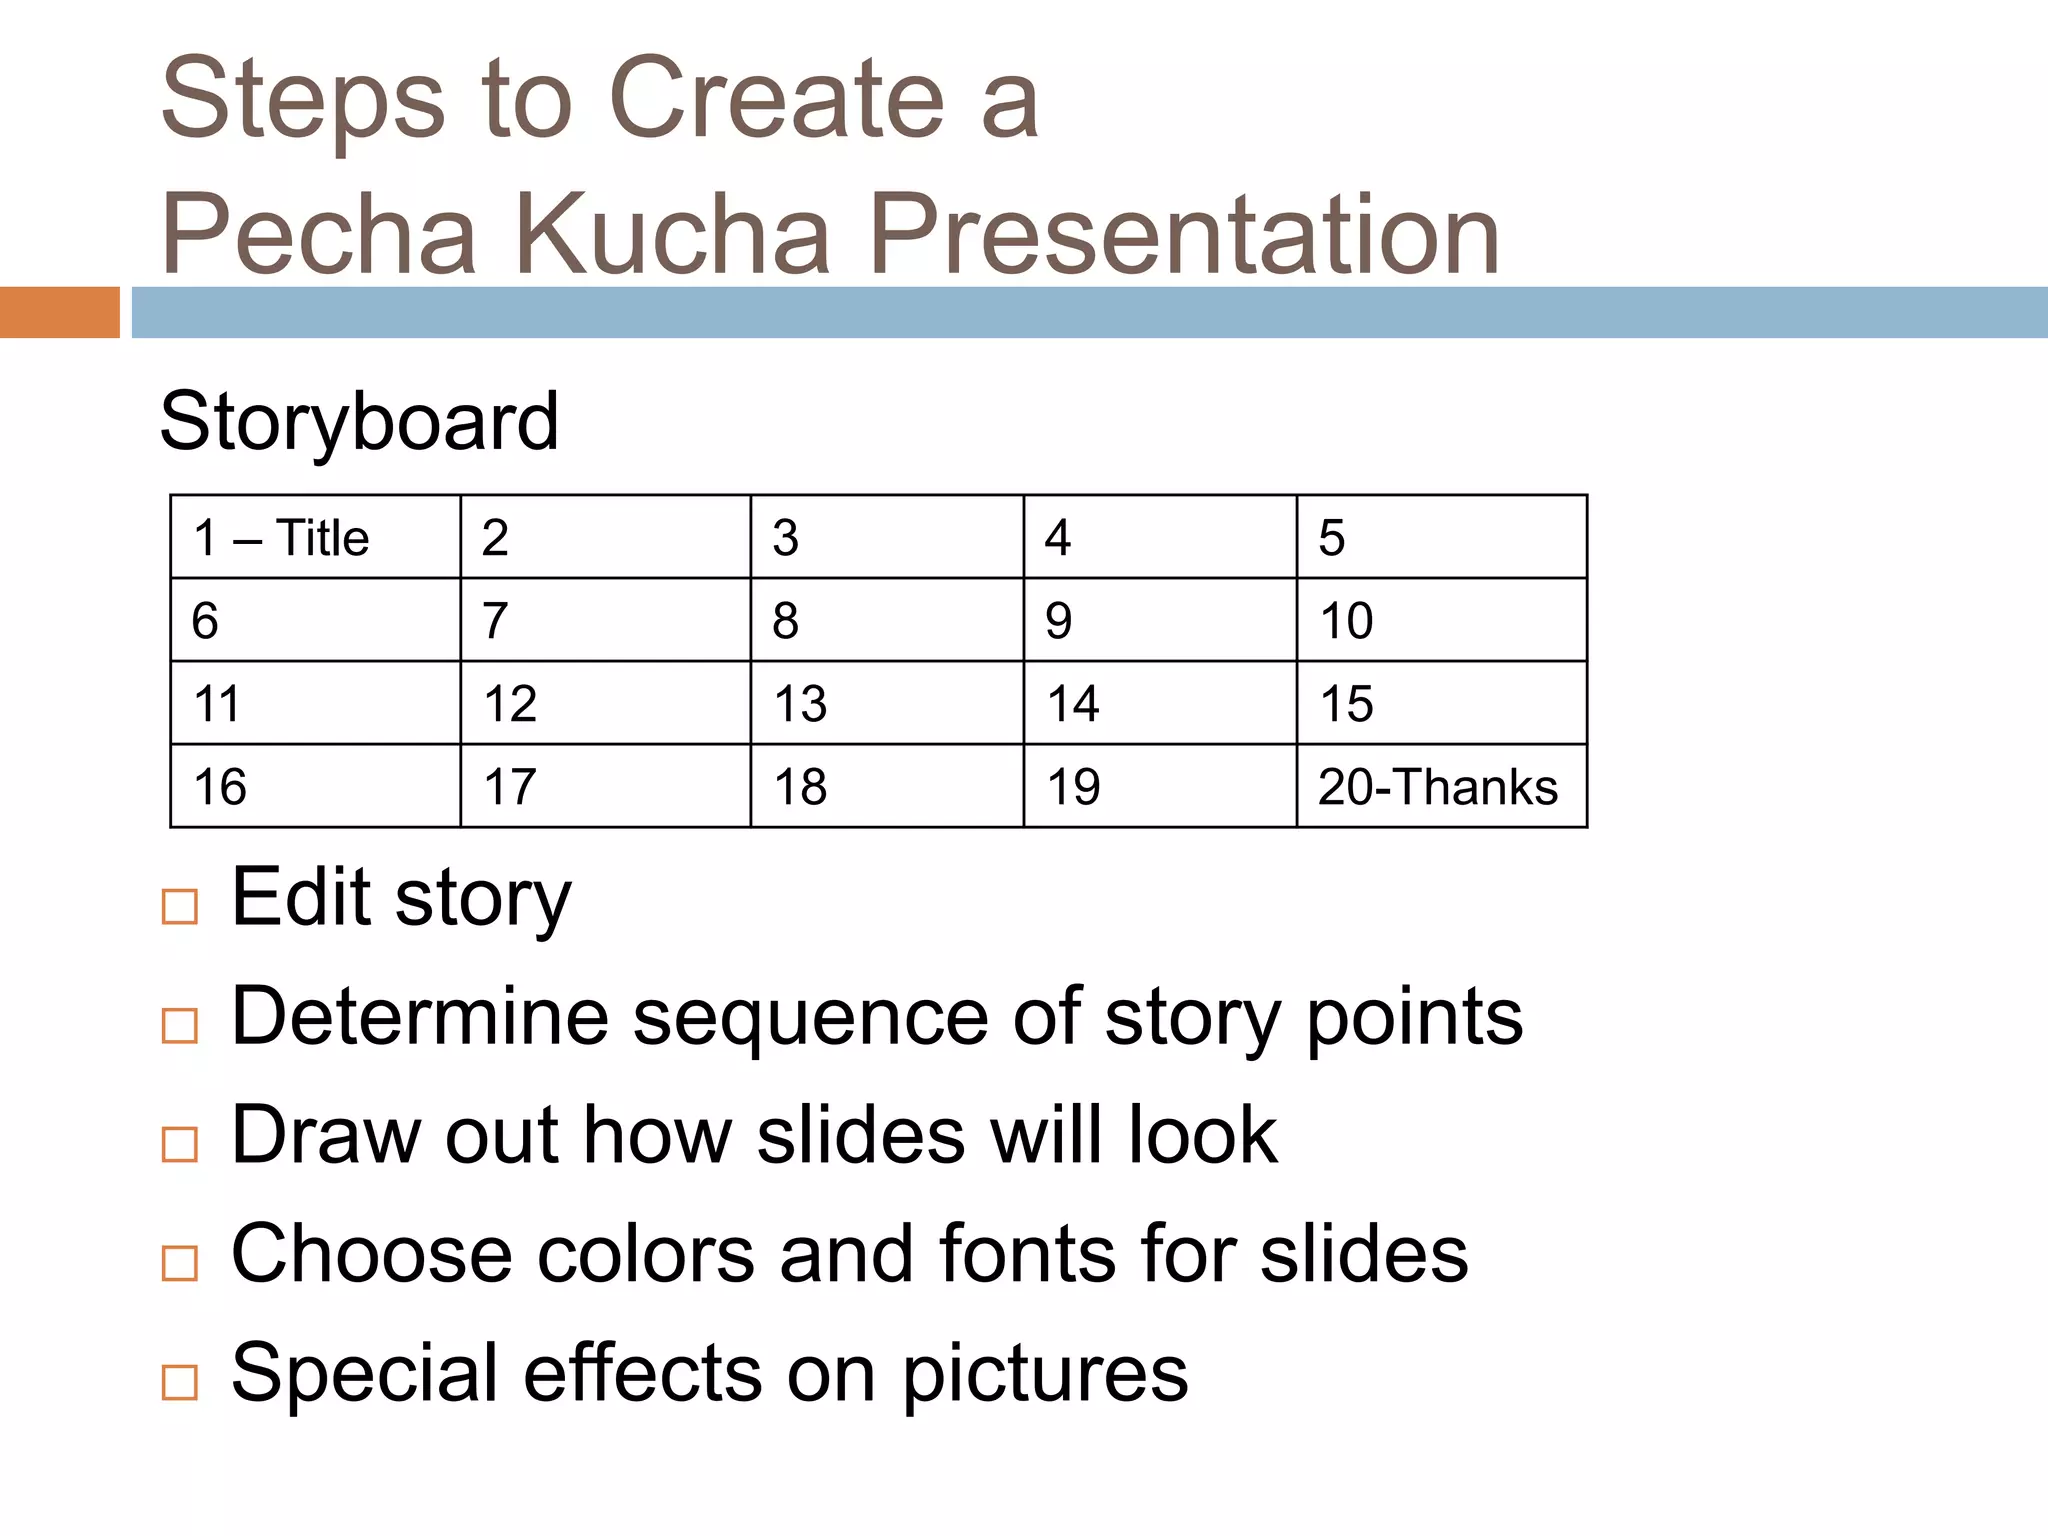
PechaKucha is a strict format: 20 images, 20 seconds each, 6 minutes and 40 seconds in total. It was created in Tokyo in 2003 by architects Astrid Klein and Mark Dytham, originally as a way to stop creative presentations becoming endless. The official format still treats images and narration as the centre of the experience rather than text-heavy slides.
DesignWhine has already covered the mechanics in our PechaKucha guide, our slide-by-slide 20×20 template and our analysis of strong PechaKucha examples. What EPIC adds is a more interesting professional use case.
EPIC2026 did not describe PechaKucha as a faster way to squeeze case studies into a conference schedule. It described them as contextual provocations and perspectives. Presenters were encouraged to zoom into one research moment, juxtapose contexts, move across scales or use imagery to create productive tension rather than tidy conclusions. PechaKucha proposals were reviewed anonymously by committee members alongside a conference program built around rigorous interpretive research.
That is a very different model from “here are our seven findings.” It treats the presentation as an act of interpretation.
The distinction has precedent inside EPIC. Earlier PechaKucha presentations have used the format to explore whether user research should be funny, whether ethnographic photographs create an unfair aura of objectivity, how roleplaying might transfer cultural understanding and how improvisation can reframe ethnographic practice. These are research ideas, but they are presented as arguments and lenses rather than compressed project reports.
Constraint Is an Editorial Tool
The obvious benefit of a 6:40 presentation is brevity. The more consequential benefit is selection.
A researcher cannot bring twelve themes, six personas, four journey maps, three caveats and every participant quote into 20 timed images. The format forces a more uncomfortable question: what does this audience actually need to understand for the next decision to become better?
That pressure is not automatically beneficial. Poor editing can simply produce rushed presentations. But empirical work on PechaKucha suggests that the constraint changes presentation behaviour in useful ways. A 2025 conference study published in the Journal of Continuing Education in Nursing found that attendees responded strongly to the format, with 68% rating it outstanding, while presenters acknowledged that the fixed timing was demanding. Earlier controlled studies have also found improvements in perceived appearance, creativity, presentation quality or audience understanding, even when learning outcomes were not universally superior.
A 2024 analysis in English for Specific Purposes is especially relevant to design researchers. It found that strong PechaKucha presentations tend to use low-density slides and tightly synchronize speech with visuals. The image is not background decoration behind the speaker. It carries part of the argument.
That is why the constraint is useful for research communication. It turns presentation design into editorial judgment. The question stops being “what should go on slide 14?” and becomes “what is the fourteenth beat of the story?”
Research Is Already Visual
UX research is unusually well suited to visual storytelling because much of the evidence is already visual.
A confused checkout can be shown. A participant’s workaround can be photographed or reconstructed. A journey can be traced through screenshots. A service failure can be represented as the moment one channel hands a user badly to another. A physical environment, device posture, accessibility barrier or repeated interaction pattern can often be understood faster through one carefully chosen frame than through six bullets describing it.
This does not mean every slide should become an emotional participant photo. EPIC’s own guidance is careful here: images are not decoration, rights and consent matter, and creators are responsible for privacy and ethical representation. Researchers have an additional obligation not to let a visually powerful anecdote overstate what the study actually supports.
The useful principle is simpler. Every visual should carry evidence, context or consequence.
That can mean a screenshot with one interaction highlighted, a single quote set against the moment that produced it, a photograph of a workaround, a stripped-back chart showing one relationship, a sequence of interface states, or an artifact from the research setting. Our guide to designing PechaKucha slides for 20-second comprehension makes the same point from the presentation side: one visual relationship is often enough.
The best research presentation does not reproduce the dataset. It gives the audience a lens through which the dataset becomes consequential.
A Six-Minute Research Story
A UX research PechaKucha should not try to allocate one slide to every research activity. A better structure is to build the 20 slides around the decision the research changed.
| Slides | Job | What Might Appear |
|---|---|---|
| 1–3 | Set the decision | The product moment, assumption or question the team needed to resolve |
| 4–7 | Enter the user’s context | Scenes, environments, screenshots, behaviors or constraints that make the problem real |
| 8–11 | Reveal the pattern | Two or three findings supported by carefully chosen evidence |
| 12–14 | Complicate the obvious answer | Contradictions, outliers, segment differences or a moment that changed the team’s interpretation |
| 15–17 | Show the consequence | What the evidence means for the product, service, roadmap or risk |
| 18–19 | Protect the nuance | Important limitation, unresolved question or trade-off the decision-maker must understand |
| 20 | Make the ask | The decision, next experiment or action the research now supports |
The structure deliberately leaves methodology out of the main sequence unless the method itself changes how the findings should be interpreted. That does not make the method unimportant. It means methodology belongs in a supporting layer that can be inspected when needed.
There is also room for a more exploratory version. A discovery study may not end in one recommendation. In that case, the 20-slide arc can move from one observed moment outward, showing how apparently small behaviour reveals a larger system. That is close to what EPIC means when it encourages presenters to expand outward from one research moment or participant.
Where the Format Fails
PechaKucha is a poor choice when the audience needs to interrogate the evidence while it is being presented.
High-stakes research may require detailed discussion of sampling, methodology, uncertainty, legal risk or subgroup differences. Complex quantitative work may depend on charts that need more than 20 seconds to read. A generative study with several competing interpretations may need pauses and questions rather than automatic progression. Accessibility needs can also make rigid pacing a bad default for some audiences and presenters.
The 2025 conference study that found strong audience engagement also found that presenters struggled with the format’s timing. That matters. The timer is only useful when it creates clarity. When it forces a presenter to race through evidence, it is doing the opposite.
There is a second, subtler risk. Storytelling can make weak evidence feel stronger. A beautifully sequenced participant story may be more memorable than the messy distribution from which it came. Researchers should be especially suspicious of any presentation technique that makes one vivid anecdote easier to remember than the limits of the study.
PechaKucha therefore works best for research communication when the analysis is already mature and the researcher knows exactly what claim each visual is allowed to support.
The Better Model Is Two-Layer
The answer is not to replace the research readout with a 6-minute performance. It is to split the system.
Layer one is the presentation. It is short, visual and designed for the room. Its job is shared understanding, consequence and decision.
Layer two is the evidence base. It contains methodology, participant information, complete findings, confidence and limitations, clips or transcripts where appropriate, supporting charts, research repository links and whatever else future teams need to inspect or reuse the work.
The presentation can then do something most research decks struggle to do: finish early enough for a real discussion.
That may be the strongest practical argument for adapting PechaKucha inside product teams. Six minutes and forty seconds is short enough to preserve ten or fifteen minutes of a meeting for questions, disagreement and decisions. The format stops the researcher from using the entire meeting to broadcast the work and leaves time for the work to become organizational.
This is not very different from the distinction between a research report and an executive summary. PechaKucha simply makes the difference impossible to ignore.
What a Good Research Presentation Does
A good UX research presentation does not prove that the team interviewed twelve people, ran eight tasks and produced 147 coded observations. It changes what the room understands about the user, the problem or the decision.
That is why EPIC2026’s use of PechaKucha is more than an interesting conference-format choice. A serious ethnographic community is making space for a mode of research communication that values provocation, imagery, interpretation and uncertainty alongside papers and case studies. It acknowledges that rigor and completeness are not the same thing as communicative effectiveness.
UX research teams could borrow that idea without borrowing the format dogmatically. The timer can become 10 minutes. Twenty images can become 12. The important principle is the separation of the research record from the research story.
The goal is not to make research smaller. It is to make the decision it supports impossible to miss.
PechaKucha works because it is ruthless about one thing most research presentations avoid: omission. It asks the researcher to decide what the audience must see, what can remain in the evidence base and what should be left out of the room entirely.
That is not a presentation trick. It is editorial judgment. And for research that deserves to change a product, it may be as important as the slides themselves.
Can PechaKucha be used for UX research presentations?
Yes, especially when the goal is to communicate a small number of important research insights, create shared understanding and drive a decision. It works less well when the audience needs detailed methodological scrutiny or complex evidence during the presentation itself.
How long is a PechaKucha presentation?
The standard PechaKucha 20×20 format uses 20 images shown for 20 seconds each, for a total running time of 6 minutes and 40 seconds. Slides advance automatically.
What should go into a UX research PechaKucha?
Build the sequence around the decision or change in understanding, not the research process. Use participant context, screenshots, artifacts, quotes, simple charts and moments of friction as evidence, then reserve methodology and detailed supporting material for an appendix or research repository.
Should PechaKucha replace a UX research report?
No. The strongest model is two-layer: a concise presentation for alignment and decision-making, plus a durable research record containing methods, evidence, limitations and supporting material.






Would you trust a six-minute UX research readout if the full evidence, methodology and limitations were available separately?